Fault reports
Fault reports capture service faults and their related parameters over a 24 hour period. “Fault Report Operation” section @10.1.2 describes its operation. The parameters are saved in a tabulated format. To access your fault reports, form the left-hand menu click Statistics → Faults
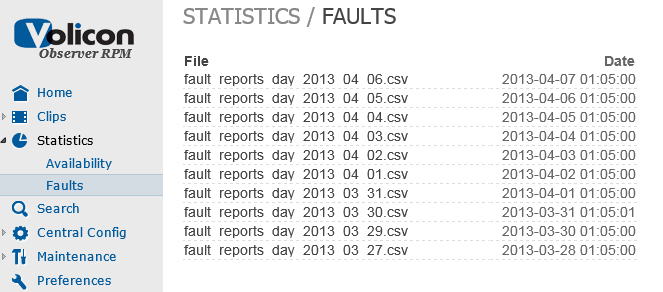
Figure: Fault Reports
Click on one of the reports to open it for viewing or right click to save the file on your machine or to a network drive. When saving, designate a folder to save the report (in *.csv format).
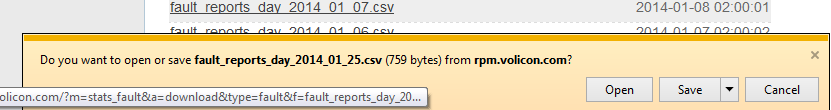
Figure: Open or Save Option
The details of the various fields are described in the next section.
Service Fault Report Parameters
You can open the report in a spreadsheet program and use its tools for analysis.
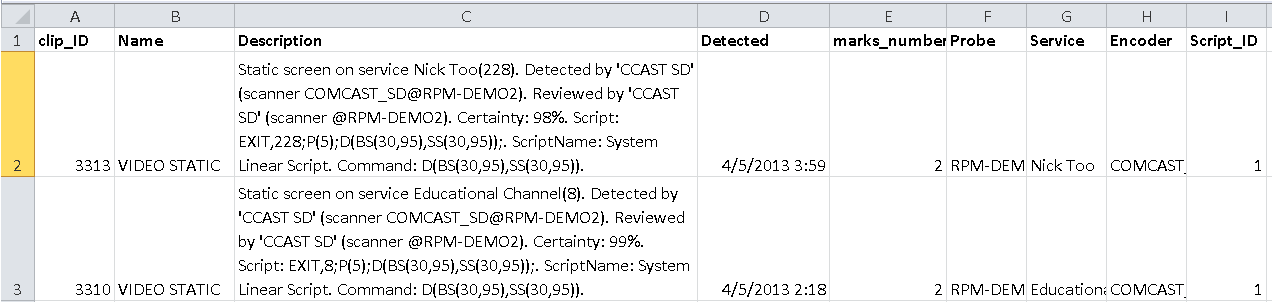
Figure: Fault Report CSV
Fault reports for services are composed of fault clips and related parameters. These parameters include the clip_ID, fault name, description, the time the fault was detected, Marks number, Probe, Service, Encoder and Script ID – See the table below for definitions of the parameters detected and assigned by the RPM during a service scan cycle:
Term |
Definition |
Lipid |
Integer value referring to an RPM fault clip uniquely. The Lipid can be used in the |
Name |
Name of the fault such as “Audio Low” |
Description |
Fault additional details: service channel number (e.g., 22), encoder display name (e.g., Orlando), audio level and script details |
Detected |
Date and time of the fault detection |
Marks number |
Number of tracks in a fault clip, see “Trk” field in “Fault Clips” section @7. After detecting the first fault on a service (broadcast channel), a fault clip is cut as the first media track. Follow up faults of same type detected on the service will add additional tracks to the fault clip. Track numbers are listed under the “No” field header in the clip player. |
Probe |
Probe server |
Service |
A broadcast service also referred to as a broadcast channel. When an encoder is set to manual mode, during fault the Service field will be NULL_STRING |
Encoder |
Module which analyzes video and media data |
Script ID |
Integer value identifying a script uniquely |
Fault Report Operation
Fault reports for services capture fault clips recorded daily and their parameters. The following faults are recorded when enabled in the RPM:
Media faults
This is only a brief description (see Observer Admin Guide for details).
Audio Low : Incoming audio stays below the low level threshold, for details see “Media faults with examples” section, RPM Guide Addendum
Audio High: Incoming audio stays above the high level threshold
Video Lost: Video frame loss is detected and persists over the duration threshold
Video Black: Video stays above the black screen and over the duration thresholds
Video Static: Video static is detected and persists over the duration threshold
Closed Captions: Used for both for closed captions and teletext missing indications
Media faults must be enabled on the probe and in the scripts (Central Config → Scripts) to be detected during scanning (see Observer RPM Admin Guide for configuration details).
Equipment and link errors
Equipment and link errors, when detected, are included in the Fault reports:
STB fault: Detecting Declared after detecting three or more faulted services of the same type
Equipment error: Related to probe server inter services error
Encoder stopped: Encoder module processing a media stream has stopped
Service stopped: Encoder service (operating system routine) has stopped
Dial error: Digit dialing errors detected with a custom script written using the Interactive Services (optional module)
Script error: This fault can be the result of:
System detected syntax error in the script
Script failure due to an IR problem
Other faults
The following faults, when detected, are included in the Fault reports:
GPI fault: Triggered by any media fault to provide an electrical alert to external hardware
NAVE TS fault: A watermark is received with an older timestamp than what was defined