Loudness Graph
The Loudness graph feature is used to display channel volume. Click the <Speaker> icon to access the feature. At the bottom of the <Settings> pane select a channel. This opens the media player and populates the bottom of the Settings pane with another icon title Metrics. Clicking the <Chevron> displays the name of the audio subsystem used to ingest the stream. Hovering over the subsystem displays a plus  icon. Press it to display a list of available graphs. In some cases the system allows you to display multiple graphs, in other cases only a single graph.
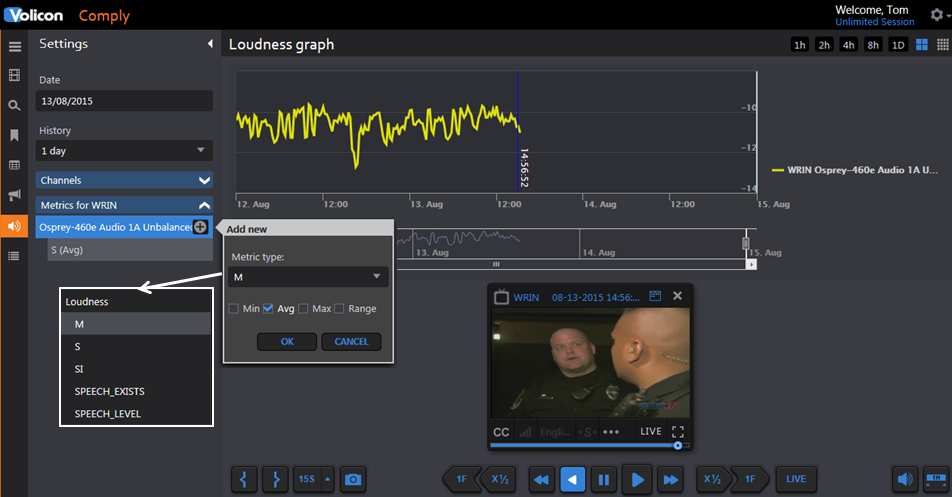
Figure: Loudness Graph
In the Setting pane specify a Date and time for the program. You can adjust the date/time by using the calendar feature of the player. If this option is left blank the player is opened in the mode specified in user preferences in the Tools menu. The example shown is live which is why the loudness graph does not extend all the way to the end. The History pulldown sets the maximum duration of the graph.
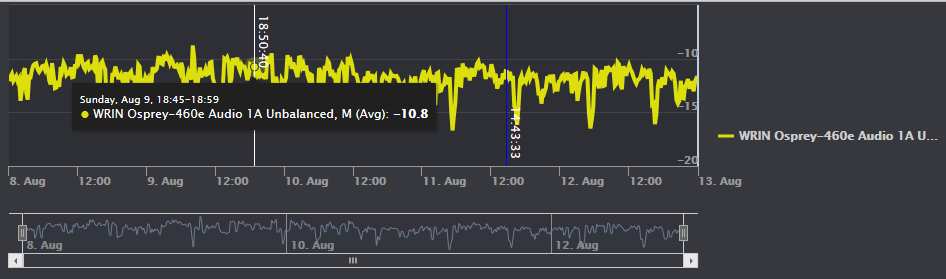
Figure: Loudness Detail
Positioning the cursor in the graph lets you zoom in on an area of interest and display the instantaneous loudness level. To examine the graph in more detail slide the bars at either end of the lower graph image to expand the upper graph. Once the graph is expanded use the left and right arrow keys of the lower graph to step through the entire range.
The graphs are color coded. Hovering over the graph identifies each color and the instantaneous value at the cursor position.
Graphing Options
M measurement |
Momentary sliding rectangular (.4s) integrated window - sampling every 100 milliseconds, calculating its average every 400 msec. These values are not configurable. |
S measurement |
Short term sliding rectangular (3s) integration window - sampling every 100 milliseconds, calculating the average every 3 seconds. These values are not configurable. |
SI measurement |
Short Integrated sampling every 100 milliseconds. MIP calculates the average every X seconds within up to 6 defined durations (usually left at the default value 10 seconds). |
Speech_Exists |
|
Speech_Level |
|
Min |
Graph Minimum loudness level |
Avg |
Graph Average loudness level |
Max |
Graph Maximum loudness level |
Range |
Shades the area between min and max graph |