Ratings Graph Tab
The ratings graph tab allows you to display rating information for one or more channels. The feature extracts data from the customer’s rating file.
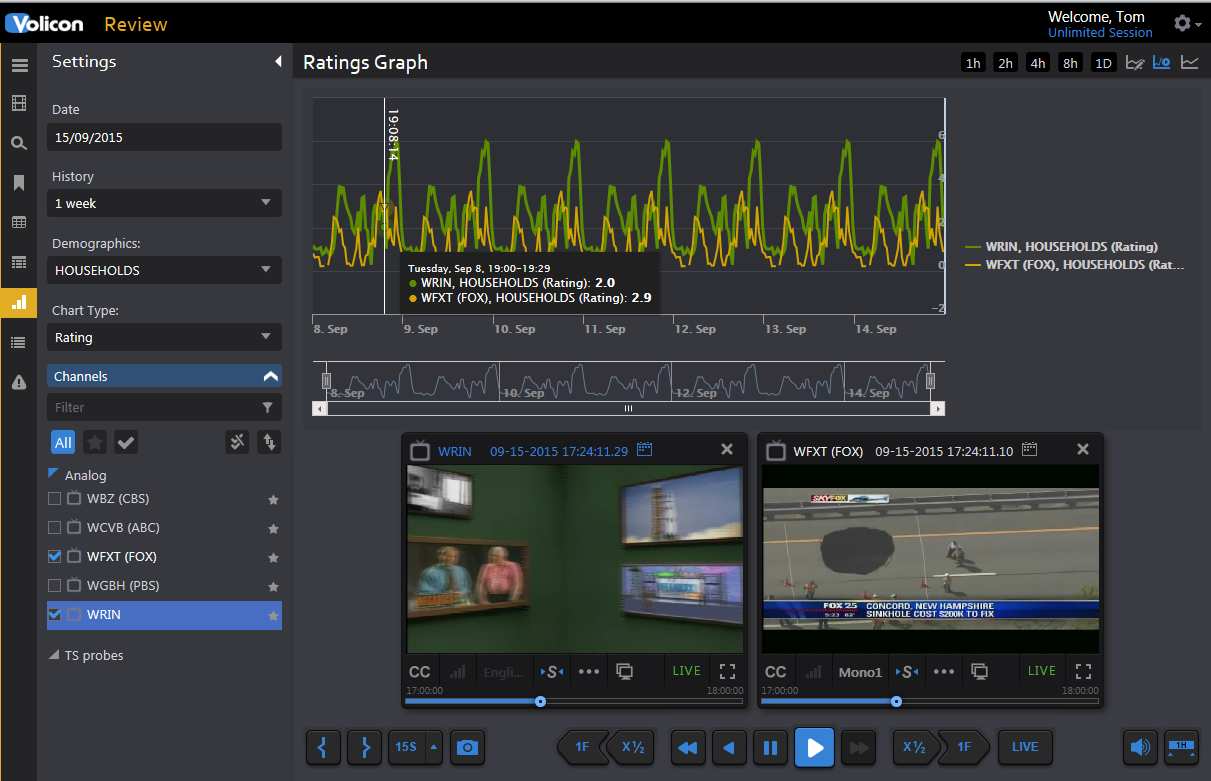
Figure: Ratings Graph
Selecting Ratings
The Settings section on the left side of the screen selects: chart type, specific demographics and the ratings time period. If more than one channel is selected the graph is color coded by channel. Hovering over the graph displays instantaneous channel ratings.
The icons at the top right of the page control the chart time frame and channel color. The chart may be displayed with the associated channel playing in the viewer or just the chart by itself.