Encoder status
The encoder status is a green, red or amber ball to the left of the item name.
 This indicates the probe or encoder is operating normally.
 This indicates the probe or encoder has stopped and needs to restart.
 Probe or Encoder is rebooting.
Hibernation means the probe is down as scheduled. Dummy Mode means the source is not available.
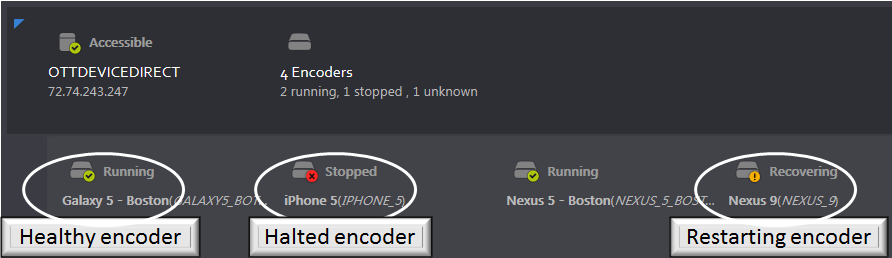
Figure: Group, probe and encoder Status
Encoder fault corrective actions
If the issue is due to the source media not being present, try to resolve it with the responsible party. (Note the corresponding probe server name and address through <Central Config>→<Encoders>).
Otherwise, if the encoder still is in red status, it could be stopped. The probe must be restarted using the probe manager.
Monitor live media streams
To verify the encoder operation, from the <Configuration>→<Probe Group> hover over the desired encoder and click <Edit encoder>. Press <Preview player> located in the diagnostic section. This opens a media player in live mode and will either display the stream or throw an error message at the top of the page.
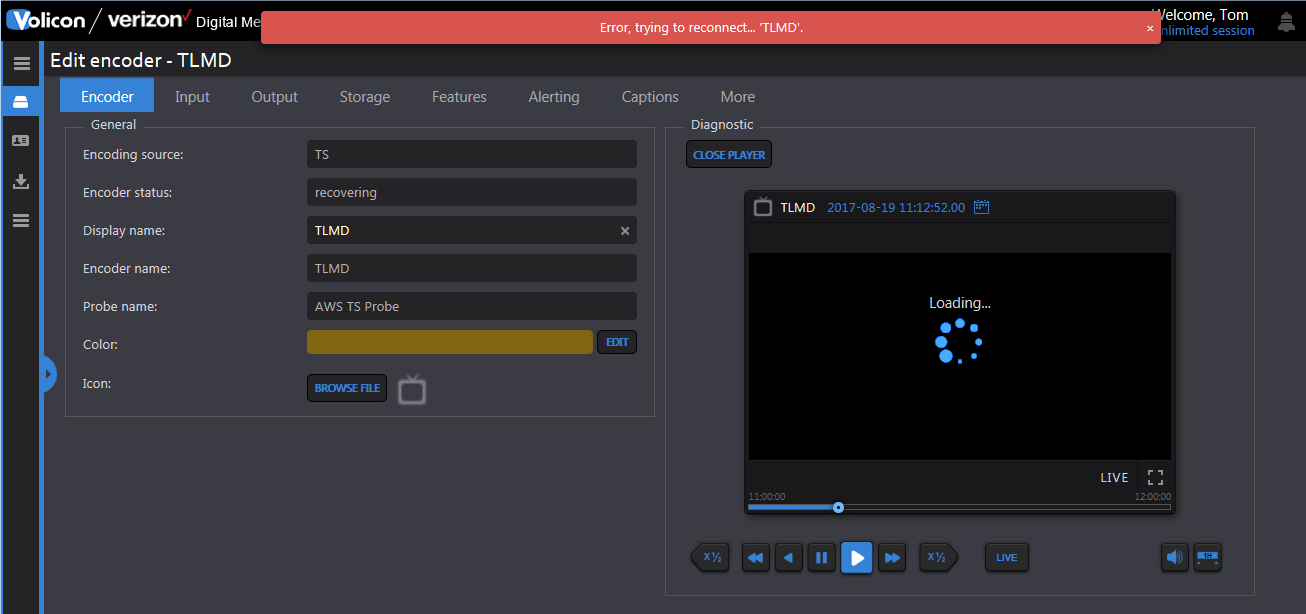
Figure: Encoder diagnostic
Memory and CPU utilization
To check memory and CPU utilization, log into the server. Open the system “Task manager” by right clicking on the task-bar of the server desktop. Select the <Performance> tab and examine “CPU usage” and “Physical Memory” usage. These values should be under control, but if for some rare reason the CPU usage or memory usage is too high, contact MIS customer support to report it and request suggestions on how to proceed.
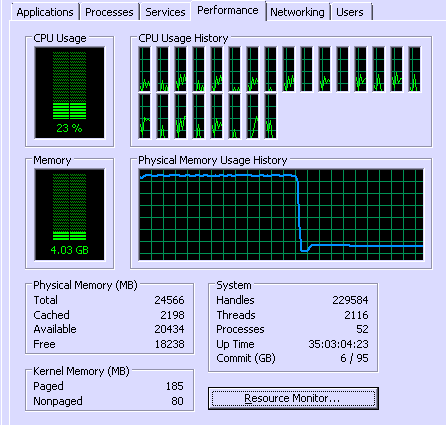
Figure: CPU and memory usage