Absolute quality graph tab
This tab allows you to monitor one or more channels. Use the “Channel” dashboard to select the channel or channels you want to monitor.
Click the <Add metric to graph>  icon associated with each channel to add one or multiple graphs. Select a unique color for each graph to make it easy to identity.
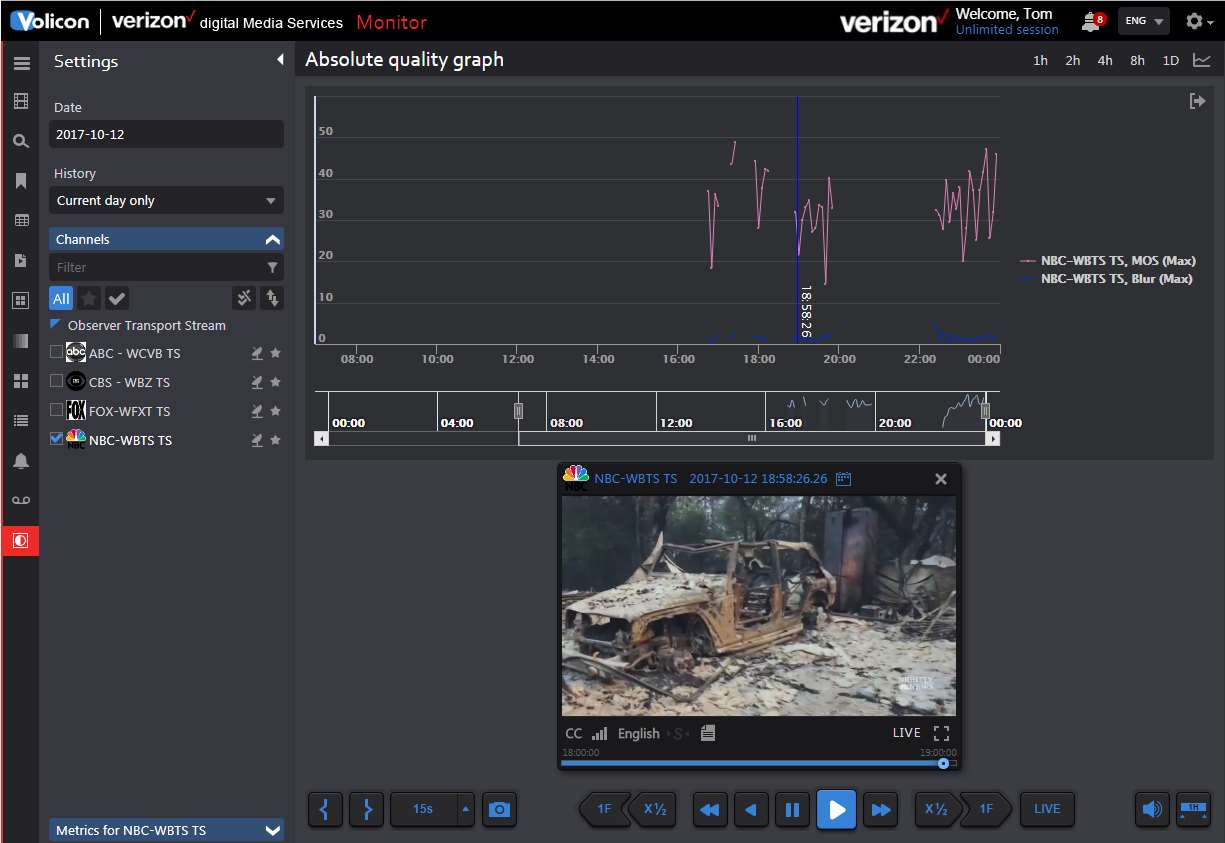
Figure: Absolute quality graph
Graphing options
There are five metrics. Each one may be color-coded and selected to display the following: average, maximum, minimum or range.
Video quality: Aggregation of all four metrics
MOS: Mean Opinion Score; perceived video quality
Blur: Image sharpness
Blockiness: Discrete Cosine Transform (DCT) digital encoding
Contrast: Difference in color and light over the image