Rating graph tab
The <Ratings graph> tab allows you to display rating information for one or more channels. The feature extracts data from the customer’s rating file.
In the example, two channels are selected and the <Sync to me> feature is used, so the ratings chart is synchronized for both channels.
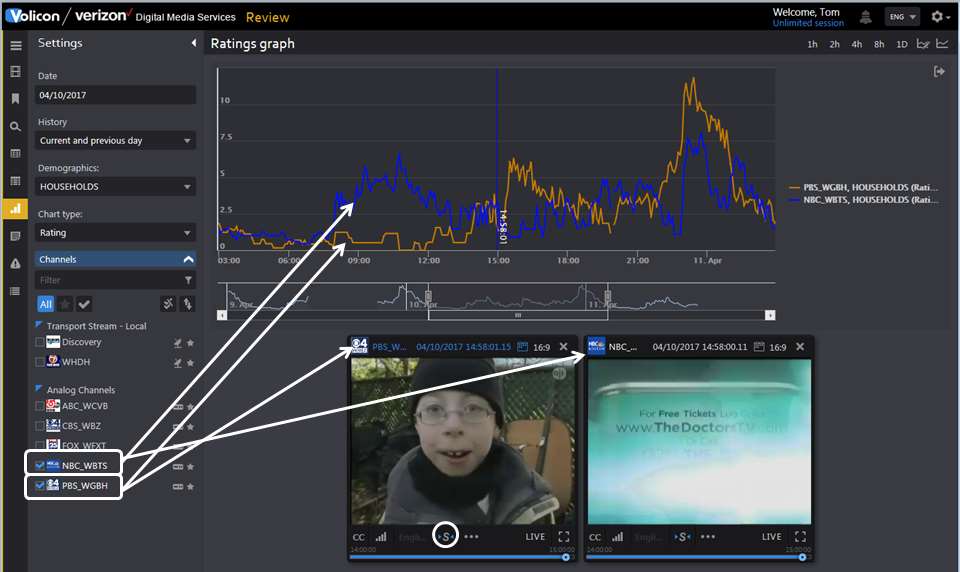
Figure: Two-channel ratings graph
Hovering over the ratings graph displays the instantaneous value.
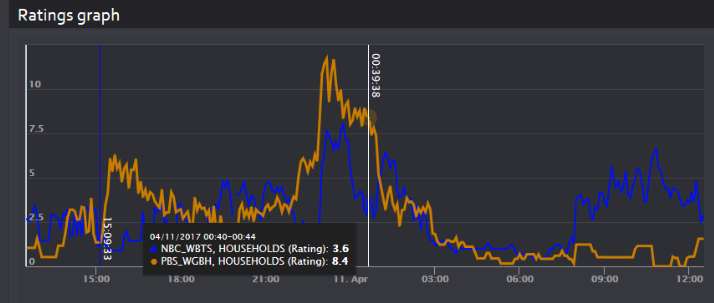
Figure: Instantaneous ratings
Select ratings
The settings dashboard on the left side of the screen has the following features:
Date allows you to select and the set date using the viewer <Calendar> function.
History sets the graph duration.
Demographics select desired demographics.
Chart type toggles between ratings and share.
Channels select one or more channels to display. This functions like other Volicon Media Intelligence service features. If more than one channel is selected, the graph is color-coded by channel.
The icons at the upper-right of the page control the chart time frame and channel color. Clicking on the timeline advances or retards the playback. Clicking the <Chart only> icon hides the viewers.