Central Configuration
Encoders
The Observer ecosystem is organized in a hierarchal manner. There are several different layers which make up the entire system: Groups, Probes, and encoders. Access probe groups, probes and encoders at Central Config> Encoders.
Group(s) - created by your Volicon administrator; it is a means to associate multiple Observer probes under one unified heading. Groups can be created by input source, geography, network capture location, etc…
Probe(s) - each server, as a whole unit, contains anywhere from one to 16 video, audio, and metadata capturing inputs. It stores all the recorded content locally and streams out the recorded content to end users.
Encoder(s) - is the High or Low bit rate proxy copy created for each item of video content recorded on the system. In the case of the Observer, it is a direct one-to-one relationship of each physical video input on the probe to the proxy stored on the Probe. In the case of the Observer TS, it is the individual channels logged inside each MPTS or SPTS.
A probe server contains one or more encoder-streams or channels.
You must assign each probe server in the system to a probe group. Use groups to help you organize your streams and manage alerts, since a probe group often shares a geographical territory or a specific service area.
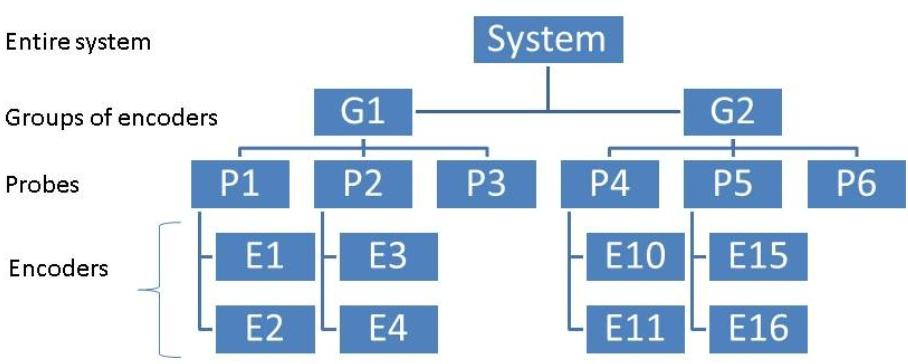
Figure: Probe Architecture
Encoder Page Fields
Access your probe groups, probes and encoders-streams at Central Config → Encoders.
From this page you can configure groups (e.g., US-COLO HD) probes (e.g., Demo- 3HD), and encoders (e.g., DEMOHD1, DEMOHD2, DEMOHD3).
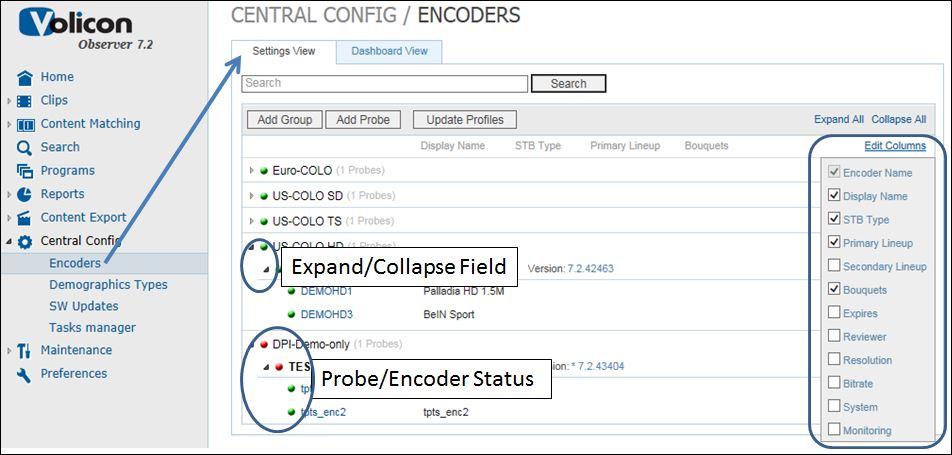
Figure: Probe groups, probes and encoders
Settings View |
The <Settings View> tab displays full information about Groups, Probes and Encoders. In order to edit any of the selections you must be in <Settings View>. |
Dashboard View |
<Dashboard View> is a simplified display of only Group and Encoder name. |
Search |
For large installations using the search feature speeds up access to desired probe or encoder and suppresses non matching fields. |
Add Group |
Used to add a new Group. A group is a collection of associated Probes. |
Add Probe |
Physical server with 1-16 capture channels. |
Update Profile |
Pushes changes out to Probes |
Expand All |
In expanded view encoders are shown in relationship to their associated Probe. |
Collapse All |
In collapsed view Probes are displayed and encoders suppressed. |
Edit Columns |
The Encoder page displays various encoder settings. Use the check box to select which fields to display. |
Expand/collapse field |
Click the arrow to the left of each Group and Encoder to expand the field click again to collapse. |
Probe/Encoder Status Indicator |
To the left of each is a status indicator, red is down green indicates operational. |
Groups
Creating Groups
A Group is simply a label use to associate multiple Probes. The first step is to create the Group name.
In either <Settings View> or <Dashboard View> click the <Add Group> button. Enter the name of the Group you wish to create then press <Add>. The new group will be populated on the encoder page. The new group is flagged in red since there are no associated Probes.
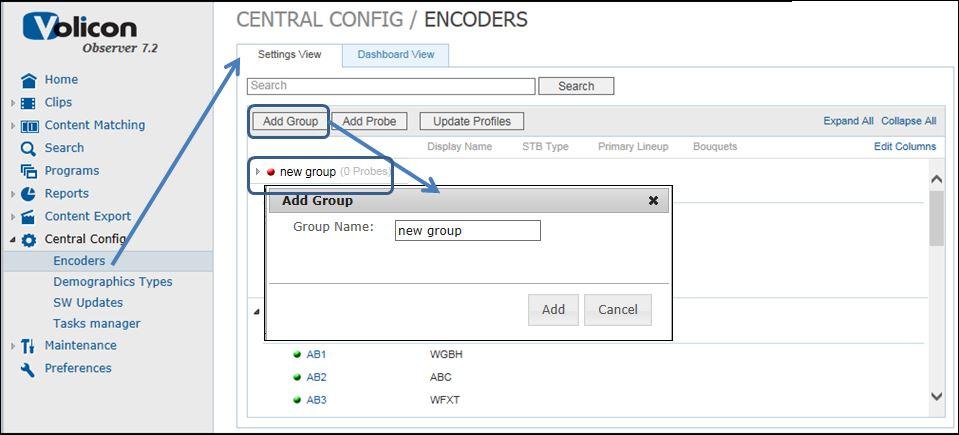
Figure: Add Group
Deleting a Group
If a Group is no longer needed hover over the Group name and press the <Delete> button. A warning message will pop up asking if you are sure. Deleting a Group has no effect on the underlying Probes it simply removes the named association.
Probes
Add Probe
To add a probe to the system, click the <Add Probe> button. The Add Probe Window will open.
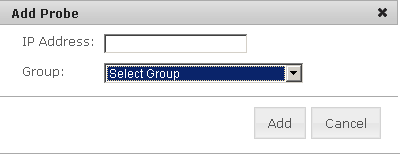
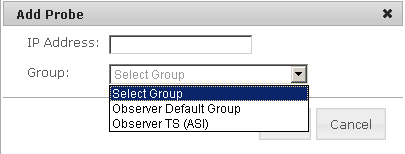
Type in the “IP Address” of a probe of interest and select a “Group” from its dropdown box to associate these together. Observer automatically extracts the probe’s name and encoder information from the probe server.
Managing Probe Server
Hovering over the desired Probe displays three buttons: <License> <Edit Probe> and <Delete> to the right of the name. Make your changes and click the <Update Profiles> button to save your work.
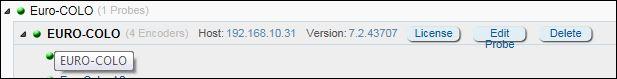
Figure: Probe Information
Probe Licenses
Press <License> to display information about installed software components.
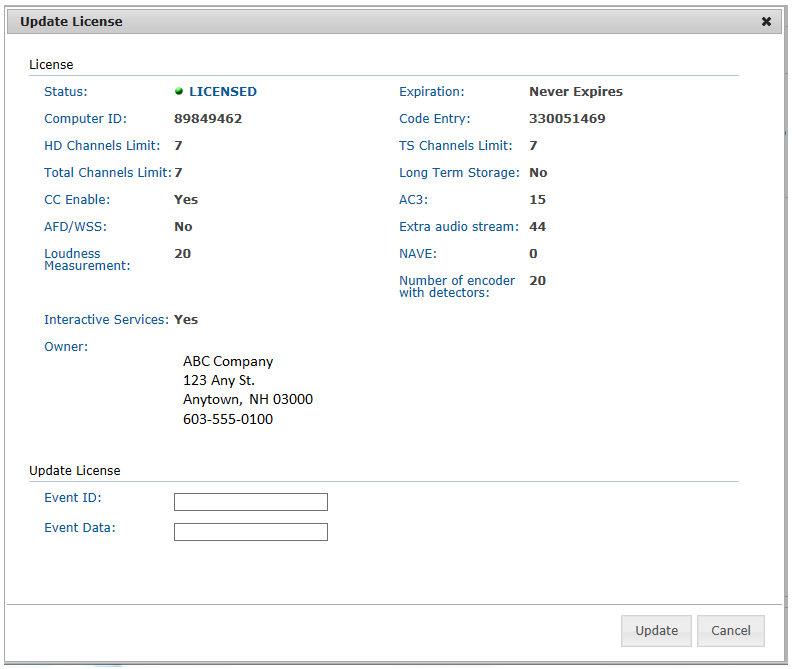
Figure: Update License Window
The Update License window provides you with the information listed in the table below.
To update your license, enter the Event ID and the Event Data you received from Volicon, and click <Update>.
|
Probe License |
|
|
License |
|
|
Status |
Green if valid license; Red if unlicensed |
|
Expiration |
Demo licenses expire, other licenses are permanent |
|
Computer ID |
Reflects License Event ID from most recent software update |
|
Code Entry |
Reflects License Event Data from most recent software update |
|
HD channel limit |
Maximum # of monitoring channels – counts toward Total Channel Limit |
|
TS Channel Limit |
Maximum # of transport streams – counts toward Total Channel Limit |
|
Total Channel Limit |
Absolute # of monitoring channels |
|
Long Term Storage |
Storage option not subject to automatic purge |
|
CC Enable |
Closed Caption monitoring |
|
AC3 |
Maximum # of AC3 audio channels |
|
AFD/WSS |
Active Format Description (AFD) and Widescreen Signaling (WSS). |
|
Extra Audio Stream |
|
|
Loudness Measurement |
Maximum # of loudness measurements |
|
NAVE: |
Nielsen Audio Video Encoder logging option |
|
Number of encoder with detectors: |
|
|
Interactive Services |
Scripting module for Interactive Services |
|
Owner |
Licensee contact info |
|
Update License |
|
|
The Update License entries at the bottom of the page are used to add optional software components. This information is provided when Probe is licensed or optional modules are added |
Probe Details
To see details on a specific Probe, hover over the Probe name and press the <Edit> button to open and display probe details as shown below.
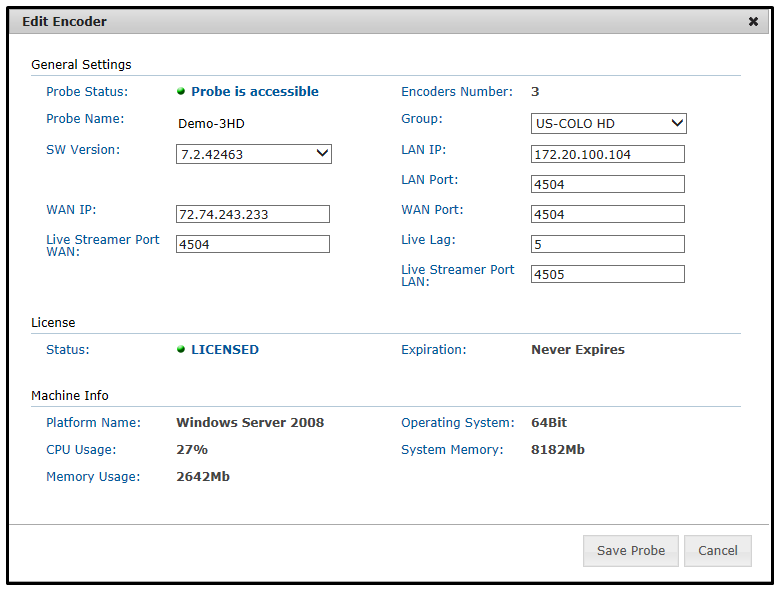
Figure: Edit Probe Details
Details on each field are provided in the table below.
Probe Status |
Green, Probe us accessible, Red Probe is not responding |
Encoder Number |
Number of Encoder channels installed on Probe |
Probe Name |
This name is extracted from the probe server during probe creation (see section “Add Probe” @ 6.0.3.1) |
Group |
Group name is selected from the preconfigured groups using a dropdown box |
SW Version (Probe SW Upgrade) |
Displays probe’s current software version. In addition, it is used to upgrade the probe by selecting a higher probe version from its dropdown list. |
LAN IP |
Address within the LAN to reach the probe |
LAN Port |
LAN TCP port of the streaming server (default is 4504) - insure it is open on route from probe to the client PC, i.e., routers; firewalls are set to permit traffic on that port. |
WAN IP |
WAN address of the Central/web server when a NAT is used. The address is used to facilitate Observer playback through the WAN. |
WAN Port |
TCP port of the streaming server (default is 4504) for the WAN connection- ensure it is open on route from probe to the client PC, i.e., routers and firewalls |
Live Streamer Port: WAN |
Low latency streaming port (input) |
Live Lag |
|
Live Streamer Port: LAN |
|
License |
“License type” (i.e. Demo) and “Expiration date” |
Machine Info |
Probe additional information: “Memory Usage” – RAM usage “Platform Name” - OS (Windows 7) “Operating System” – 32/64Bit “CPU Usage” – i.e. 11 “System Memory” - RAM size |
To complete the operation, press the <Save Probe> button.
Delete Probe
When you delete a probe, an “Alert” popup screen will appear - press <Yes> to confirm the deletion of the probe. Deleting a probe deletes it from the Observer Media Player. It does not stop the probe from continuing to capture content or stop any service running on that probe.
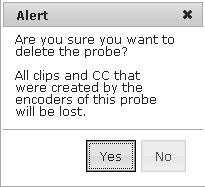
Figure: Alert Window
Encoder Details
To edit an individual encoder within a specific Probe, hover over the encoder name. An <edit> button will appear to the right. Click on the button or left click on the encoder name itself.
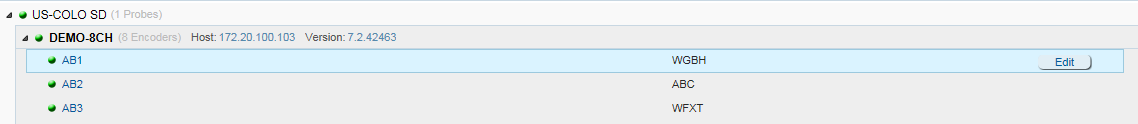
Figure: Edit Encoder
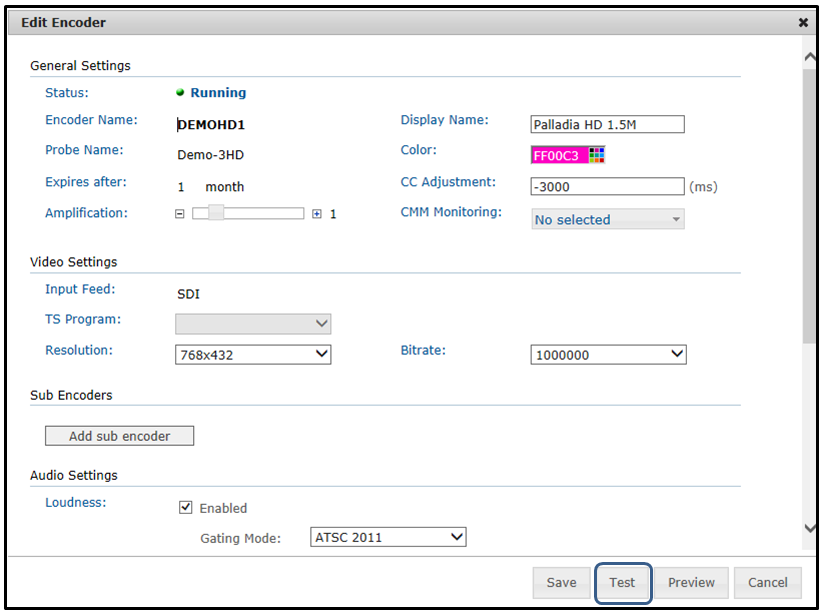
Figure: Encoder details Page
Test the connectivity of the new encoder-stream by pressing the <Test> button.
Press the <Save> button to complete the encoder edits.
Details on each field are described in the table below.
Status Indicator |
Media stream status such as running. It is also stopped, also reflected by color. The color of Encoder-stream status such as RED - Running, Stopped, is also reflected by the status icon color. |
Encoder Name |
Name of an encoder (usually four on a probe); set up with a Probe Manager |
Display Name |
Frontend, friendly name for the encoder/channel |
Probe Name |
Inherited from the Probe server Encoder is attached |
Color |
Helps users to distinguish between the encoder- channels; user configurable property, also used in graphing colors |
Expires After |
Define period for keeping video and CC data |
CC adjustment |
Time adjustment for CC, usually left at the default value |
Amplification |
Adjustment of audio level within the Observer system. It’s better to adjust the signal outside the probe before it gets to the probe server. |
CMM Monitoring |
Enable optional content matching for this encoder |
Video Settings |
“Input Feed” - i.e., TS, SD (read only, not configurable from GUI) “TS Program” – Transport Stream selected channel (read only, not configurable from GUI) “Resolution” – capture and streaming output resolution, i.e., 640x360 “Bitrate” - – capture and streaming output bit rate In bits per second, i.e., 1000000 bps |
Sub Encoder |
Create additional video encoder, typically configured for lower bit rate |
Audio Settings |
“Loudness Meter” (Enable checkbox), - See “Loudness Monitoring”, an optional module |
As-Run Log Settings |
Time Zone offset, sets local time zone offset from UTC for time stamping |
Test Button |
Runs test to Insure the frontend connects to the encoder and the new configuration is working properly |
Preview Button |
Press to display and preview the input video |
Sub-Encoders
Each encoder has a primary video codex that creates the channel stream digital multimedia archive. If desired, additional encoders may be configure. Sub- encoders are typically set for lower resolution and bit rate then the primary codex to serve specific monitoring or file exchange requirements.
Adding sub-encoders have the same server requirements as the identical setting for the primary codex. CPU cycles are needed for the compression engine an disk storage for the resulting file.
Loudness Monitoring
With the optional loudness module enabled, the Observer and Observer TS systems perform loudness meter measurements to meet the following standards: EBU R 128, BS-1770-1, BS-1770-3, ATSC A/85 and EBU Tech 3341/2/3.
Volicon’s loudness module is accurate per each frame of video and takes a measurement every 100 milliseconds. Measurements can be done with or without gating windows (-10 dB but adjustable) over:
Momentary( M) - is an average over 400ms
Short term (S) - is an average over 3s
Short Form integrated are measurements which are two minutes or shorter. There are a total 7 user defined, configurable measurements - e.g. 10s, 30s, 60s…). By default Volicon sets the short term values as follows: 10, 15, 20, 30, 60, 120, 0.
Long Form Integrated measurements greater than two minutes. There are a total of 7 user defined, configurable measurements - e.g. 1 hour, 6 hour, 1 day, 5 day) intervals. By default Volicon sets the long term values as follows: 60, 360, 1440, 0 , 0 , 0, 0.
Loudness Range Measurement (LRA) quantifies the variation in a time-varying loudness measurement. Loudness Range is supplementary to the main audio measure, Program Loudness, of EBU R 128. Loudness Range measures the variation of loudness on a macroscopic time-scale, in units of LU (Loudness Units). The computation of Loudness Range is based on a measurement of loudness level as specified in ITU-R BS.1770, albeit with a different gating threshold. Loudness Range should not be confused with other measures of dynamic range..
For Audio Loudness standards, graphing, data export and Program Loudness Reporting (PLR) details see the Observer User Manual, “Loudness Monitoring” section.
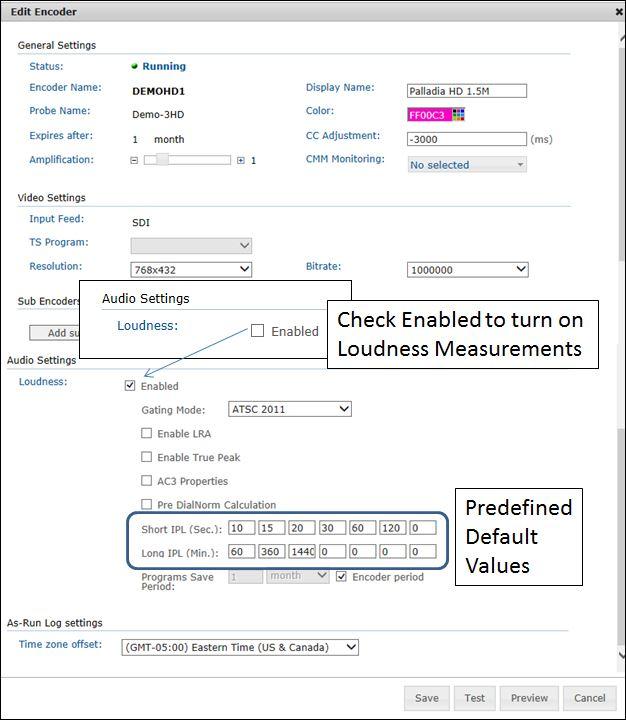
Figure: Loudness Configuration
Loudness Configuration
To configure the basic loudness parameters, go to <Central Config> → <Encoders>. Click on an encoder to edit its loudness parameters. Click the <Loudness Enabled> checkbox. This expands the Loudness section.
Note
Very important: The loudness license must be enabled on the probe. Activating Loudness without the proper license for all configured audios per channel could result in disabling the capturing and encoding process.
For Loudness configuration parameter details see the table below. Complete your choices, and click <Save> to push your configuration to the encoder.
Table: Loudness configuration¶ Loudness measurement enable
Enables loudness metering for all configured audios on this specific channel
Gating Mode (pulldown)
Complies with the ATSC 2011, ATSC 2013 and EBU standard for gating loudness measurements; enabled either in frontend and backend, see figures above
Enable LRA
Loudness Range Average quantifies the time-varying loudness measurements. LRA is the lowest peak to highest peak change over each configured time interval. For more details on LRA see the “Observer User Manual” section “Programme Loudness Range LRA”.
Enable True Peak
Enables monitoring the value of the audio signal waveform of a program in the continuous time domain; detects peak loudnesses that otherwise would escape the sampling process.
AC-3 properties
Processed with loudness range algorithm
Pre DialNorm Calculation
DialNorm indicates the level of average spoken dialogue within the encoded audio program. Typical values for short and long term are factory preset. DialNorm should be enabled whenever an encoder is ingesting a digital audio stream such as optical, s/pdif, or Dolby AC-3
Short IPL (Sec)
Short Integrated Results
7 defined sampling durations (usually left at the default values). The durations can be graphed - see Observer User Manual 6.2 section “Audio loudness graphing parameters”.
Long IPL (Min)
Long Integrated Results
7 defined sampling durations (usually left at the default values). The durations can be graphed - see Observer User Manual 6.2 section “Audio loudness graphing parameters.
Input Adjustment
If measurements are being made without dial norm and not using the EBU standard, this value can compensate for the difference in measurements from dial norm value. This setting is usually enabled when making measurements from a Set Top Box which does not pass dial norm data.
Program Save Period:
These measurements may be saved for the same time set of other Encoder setting or explicitly set to a different amount of time.
Software Updates
Periodically, Volicon releases new software for the Observer. The upgrade process is managed in conjunction with Volicon support.
Volicon Support will email you the Software Release Installer(s), with a file name of ProbeSetup ####.msi. Download the software and save it to a directory on your local or available network storage.
Uploading New Software
Once you receive the latest software, an authorized Admin can upload the installer(s) on the Central server. To do so:
Go to <Central Config> → <SW Updates>.
Browse to the new installer. The Observer will verify the installer you choose.
Once the installer is verified, the <Upload Installer> button activates.
Click <Upload Installer>. The Central server will make the release available for all probes.
Note
This action makes the new software available, but does not automatically update any probes at this point.
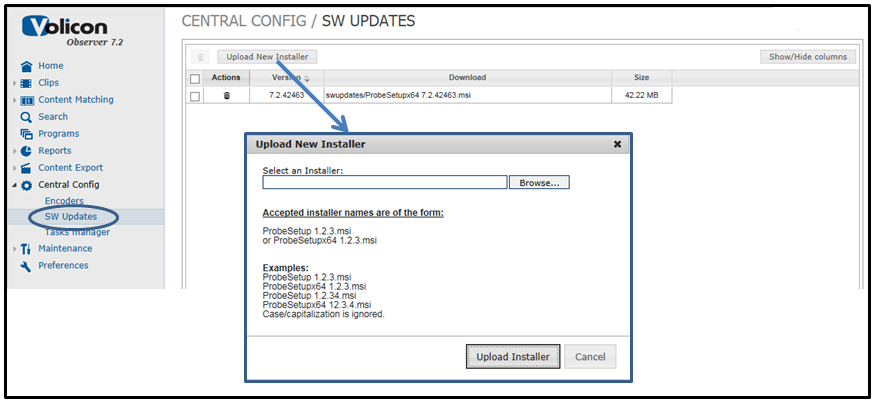
Figure: Software Update
If multiple software releases have been saved Central Config displays them in an ordered list with the most current revision at the top.
Press the <Trash Can> icon to delete unneeded old revisions.
Probe Software Update
When you are ready to upgrade a probe, go to <Central Config> → <Encoders> and hover over the desired probe. Access the pulldown labeled SW Version to select a higher software version. Press the <Save Probe> button at the bottom of the page to commence the update process. When the update finishes a status message is displayed at the top of the page.
Note
During the update process the Probe service is stopped and then automatically comes back on line when the update completes. This will result in a short loss of captured content for up to two minutes.
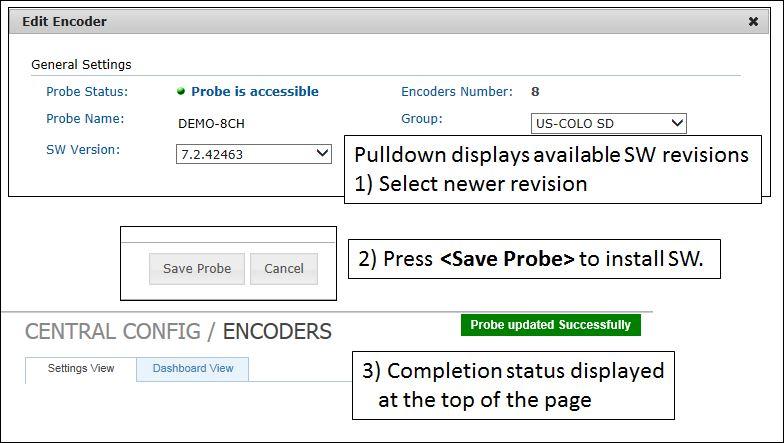
Figure: Probe Software Update Procedure
Task Manager
This page displays the status of scheduled tasks. In the <Actions> column at the extreme right of the page are icons that let you manually select the task to run and enable/disable automatic dispatch.
Note
Stopping ANY process could have a negative impact on the Observer System. Do NOT stop or start any Tasks without previously conferring with a Volicon Support team member.
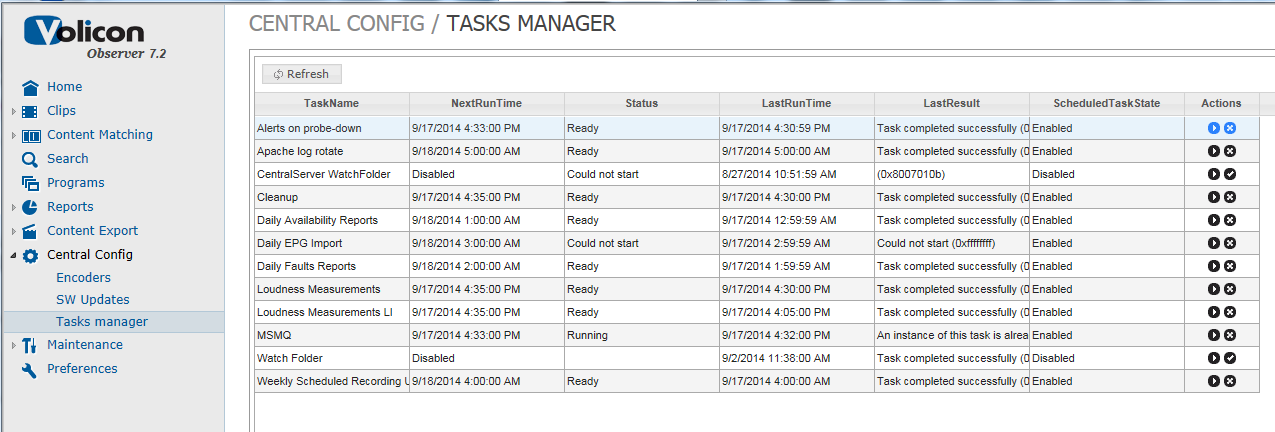
Figure: Task Manager