Checking the Encoder Status
Access probe and encoder status by clicking <Central Config> → <Encoders> to open the top level Encoder page. Status is denoted by a Green or Red ball to the left of the item. If a lower level item (Probe or Encoder) fails the status is propagated toward the parent. If any item below the parent fails the parent icon will be red.
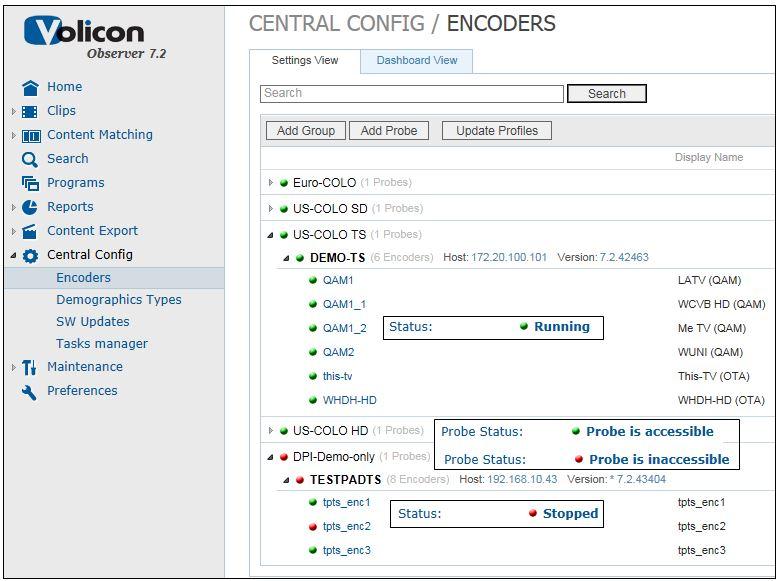
Figure: Group, Probe and Encoder Status
Probe Fault
Under normal conditions the Probe status icon is green, if one of the Encoders fails or the Probe is inaccessible Observer turns the icon rd.
Monitor Media Streams
To open several encoder/streams at a time in the “Home Page” see “Observer User Manual” (Figure: Home Page), select check boxes in the Dashboard in front of the corresponding players. Press the <Live> button. Check to see if all the players are streaming current video.
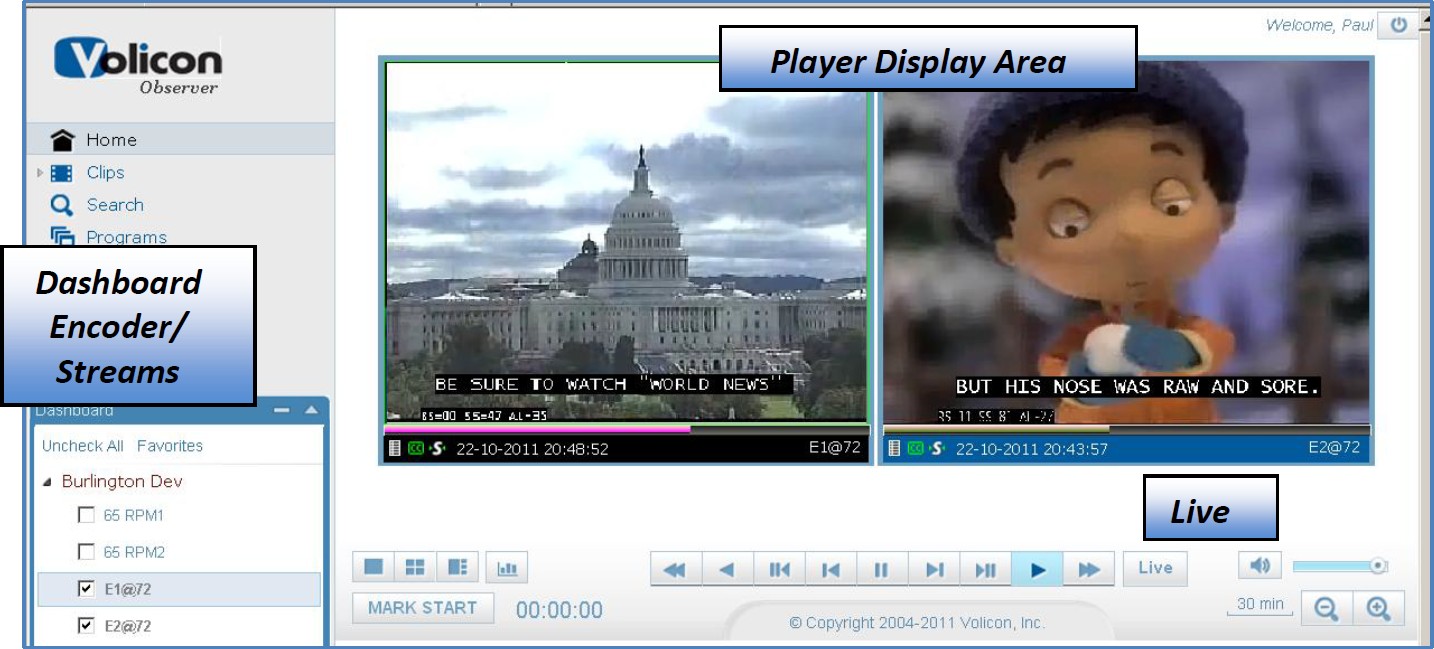
Figure: Home Page
If the players are not streaming live video, check the error type usually displayed above the “Player Display Area”. Then take corrective actions as in sections “Encoder fault” @21.0.3 and “Encoder fault corrective actions” @21.0.4 below.
Encoder Fault
In the event of an encoder fault, check the encoder indicators, the round icons in front of the probe server and the encoder names for status. If the indicators are green, the encoder is working. If they are red, the encoder is stopped or you have media stream issues. Check to see if all the indicators are green. If not, double-check your media streams; follow the procedures in the “Monitor media streams” @21.0.2 section above.
Encoder fault corrective actions
If the issue is due to the source media not being present, try to resolve it with the responsible party. (Note the corresponding probe server name and address through Central Config → Encoders).
Otherwise, if the encoder still is in red status, it could be a stopped encoder. Restart it using Probe Manager.
Checking Memory and CPU Utilization
Observer provides a quick way to view system resource utilization without the need to log into Windows. Open the <Encoders> page and hover of the desired Probe server then click the <Edit Probe> icon. The Machine Info section at the bottom of the page lists Operating System resource utilization.
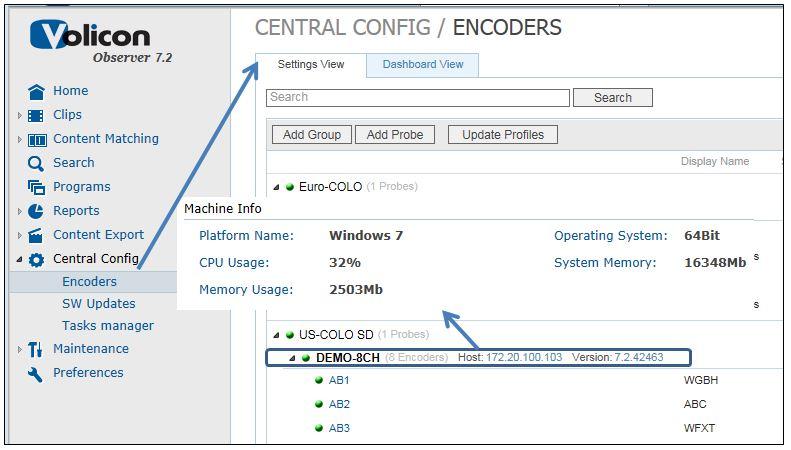
Figure: Operating Resource Utilization
Windows Task Manager
To check memory and CPU utilization, open the system “Task manager” by right clicking on the task bar of a server desktop. Select the “Performance” tab and examine the “CPU Usage” and the “Physical Memory” usage. These values should be under control but if for some rare reason the CPU usage or memory usage is too high, contact Volicon Customer Support to report it and for suggestions on how to proceed.
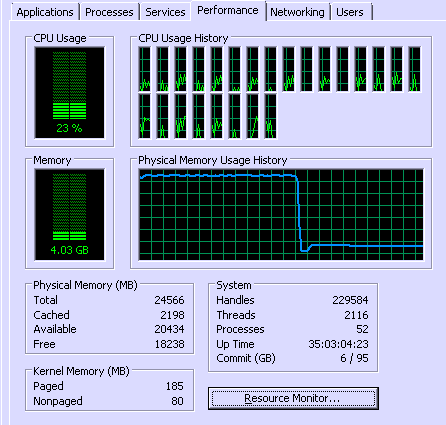
Figure: CPU and Memory Usage